Indeed, the 80/20 rule is a fundamental principle in content marketing. It highlights the fact that a significant portion of the outcomes, such as website traffic and conversions, stem from a minority of the content created.
In virtually every website and during every content audit, this pattern emerges. A select few articles become major drivers of traffic and conversions, while the majority of the content contributes minimally, if at all.
When you examine your data, you’ll likely observe a similar trend. A detailed analysis of your top posts by traffic will reveal a familiar pattern: a handful of posts garner substantial traffic, whereas most articles generate little to no traffic at all.
This phenomenon underscores the importance of focusing efforts on optimizing and promoting the content that truly resonates with the audience, as it significantly influences the overall success of your content marketing strategy.
When you analyze the conversion rates of individual pieces of content, a consistent trend emerges. Some articles excel at converting visitors, while the majority either have low conversion rates or fail to convert visitors altogether.
Conducting a Content Audit to Identify High-Performing Content Articles
Imagine your website is like a library with lots of books. Now, here’s an interesting fact: only a few of these books are super popular, bringing in most of the readers. The tricky part? We don’t always know which books these are. To figure it out, we use something called a “content marketing audit.”
Today, we’re going to do this audit using tools like Google Analytics and Google Search Console. These tools help us look closely at three main ways people find our website: through search engines (like Google), emails, and social media.
We’ll be checking which articles are the real heroes, pulling in lots of visitors. For example, we’ll look at:
- Search Engine (SEO): Articles that draw in visitors from online searches.
- Search Engine (SEO): Articles that are gaining or losing popularity in search results.
- Search Engine (SEO): How well specific keywords perform for any article.
- Search Engine (SEO): Articles with the potential to rank higher in search results.
- Email: Recognizing our most effective email campaigns.
- Social Media: Identifying the social networks where our content performs exceptionally well.
- Social Media: Pinpointing the content that receives the highest traffic and engagement on social platforms.
- Determining the Best Performing Platform for This Article: Figuring out where this specific article gets the most attention.
By doing this, we can figure out what’s working best for us. At the end of each section, there are tips on what to do next based on the data. It’s like finding the most-loved books in your library and making sure more people get to read them!
1. Articles That Draw in Visitors From Online Searches
Understanding which channels work best for your content is key to successful marketing. Some focus on social media, while others rely on evergreen SEO content. But not all channels deliver the same results.
Here’s a simple guide to figure out where your content shines:
- Head to the Reports Section: Start by going to the Reports section in your dashboard.
- Access Traffic Acquisition: Click on “Acquisition” and then choose “Traffic Acquisition.”
- Customize Your Report: Click on the pencil icon in the top right to customize your report. You need to be logged in with an account that has more than just basic access.
- Select Useful Metrics: Click on “Metrics” and choose the metrics that matter. We recommend considering Users, Sessions, Engagement Rate, Average Engagement Time per Session, Bounce Rate (although less significant than engagement rate, some find it useful), and Session Conversion Rate.
- Add Bounce Rate and Session Conversion Rate: If Bounce Rate and Session Conversion Rate aren’t in the list, add them. Click “Add metric” at the bottom of the list and search for them.
- Arrange Your Metrics: You can reorder the metrics as you prefer to customize your report.
With these steps, you’ll gain a clear picture of how your content performs across different channels, helping you make informed marketing decisions.
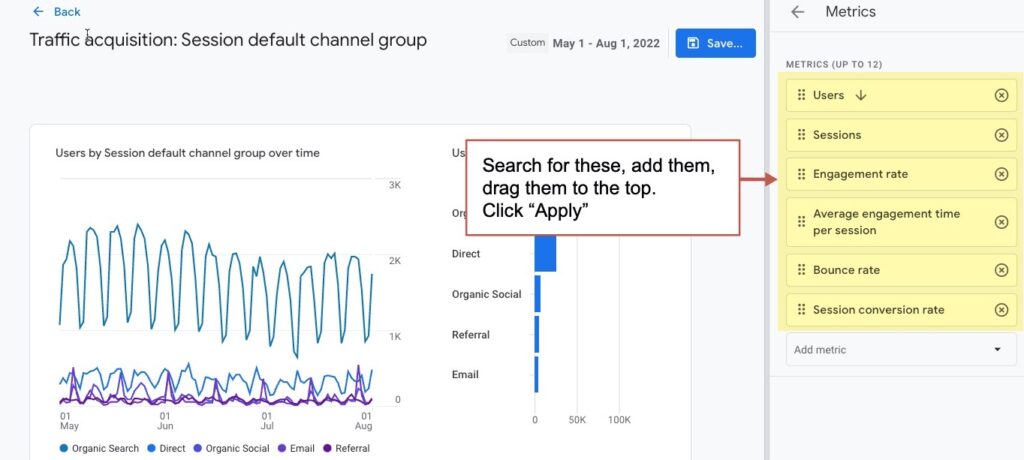
Now click “Metrics” to select some useful metrics. We recommend the following:
- Users
- Sessions
- Engagement rate
- Average engagement time per session
- Bounce rate (less meaningful than engagement rate, but some people still like it)
- Session conversion rate
Reorder the metrics if you’d like. Here’s what the customization will look like:
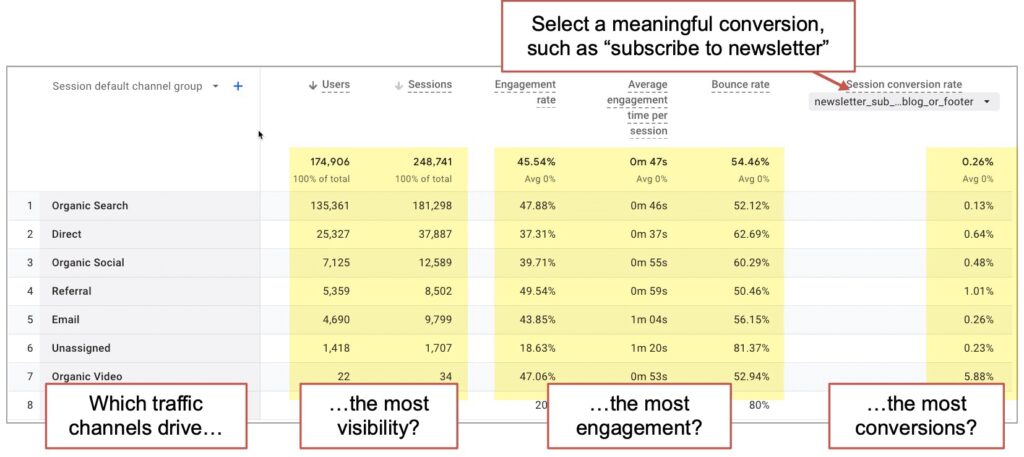
Now, you’re examining the effectiveness of each “default channel group,” which represents the primary sources of your website traffic. By comparing the metrics for each group, you can identify their specific strengths.
Upon closer inspection, you’ll observe that certain channels excel at attracting visitors, while others are more effective at engaging and converting them into active participants. If you’re aiming for a benchmark engagement rate, it’s noteworthy that our research indicates an average of 55% across various channels.
Next Action Items
Broad data like this might not be ideal for decision-making. Are your email visitors engaged? How are your Google Ads performing? We’ll dive deeper into the analysis shortly.
However, the overall impact on your content strategy typically boils down to these principles:
- If It’s Not Working, Take Action: If a particular strategy isn’t yielding results, it’s time to either fix it or consider abandoning it altogether.
- If It’s Working, Invest More: On the flip side, if a strategy is proving successful, it’s wise to double down on it. Allocate more resources and effort to amplify what’s already working well.
2. Articles That Are Gaining or Losing Popularity in SERP
Certain pages maintain a consistent presence in search results. People search for specific topics, these pages rank high, visitors click on them, and the pages continue to attract a steady flow of traffic. Content marketers, just like SEO experts, need to keep an eye on these pages.
The good news is that identifying your top-performing pages is quite straightforward. Here’s how you can use GA4 to pinpoint your best pages for organic search performance:
- Navigate to Reports: Start by going to the Reports section in your GA4 dashboard.
- Explore Engagement Data: Click on “Engagement” and then select “Pages and Screens: Page Title and Screen Class.” Since we’re interested in content, this is where we begin.
- Set Primary Dimension: Above the first column in the data table, you’ll find a dropdown menu for setting the primary dimension. Choose “Page Path and Screen Class,” essentially the page’s URL. Next, we’ll refine our focus by applying a filter to specifically view organic traffic.
- Add Filter for Organic Traffic: Click on “Add Filter” located above the line chart. This action will reveal the “Build filter” options on the right side. Similar to Universal Analytics, GA4 filters permit you to include or exclude specific values from any dimension.
- Select the Dimension: In this case, we want to work with the “Session Medium” dimension. Click on the dropdown menu of dimension values below, and check the box next to “organic.”
- Apply the Filter: Once you’ve chosen the value (in this case, “organic”), click “OK.” To implement the filter in your report, click on “Apply” situated in the bottom right corner.
Now you’re looking at a list of all of your top-performing articles from search. This is an SEO report and these are your winners.
Next Action Items
Many of these pages will likely be ten times more visible than your other content, offering valuable insights we can leverage.
- Create More Similar Content: Understand the common traits among these articles. Are they more detailed? Do they focus on specific topics? Are they frequently linked to other articles? Analyze and replicate these successful elements in your future content.
- Introduce Calls to Action (CTAs): Given their high visibility (think of them as your best cheese), enhance these pages by adding internal links and compelling calls to action. Direct traffic from these popular pages to your highest-converting articles (your best mousetraps).
- Exclude Them Strategically: Some exceptional pages might skew data in other reports. Instead of removing them entirely, which carries a cost without any benefit, consider excluding them from Analytics. This ensures your reports stay accurate and focused, without interference from these outliers.
3. How Well Specific Keywords Perform For an Article
Consider this your early alert system. By closely monitoring shifts in organic traffic for individual articles, you can proactively address any issues before they escalate, safeguarding your overall website traffic.
Moreover, if you’ve been observing a particular high-traffic post gradually losing its rank, you won’t be caught off guard when your overall organic traffic decreases.
To keep track of these changes in search traffic for specific URLs, you can easily add a comparison to your date range analysis.
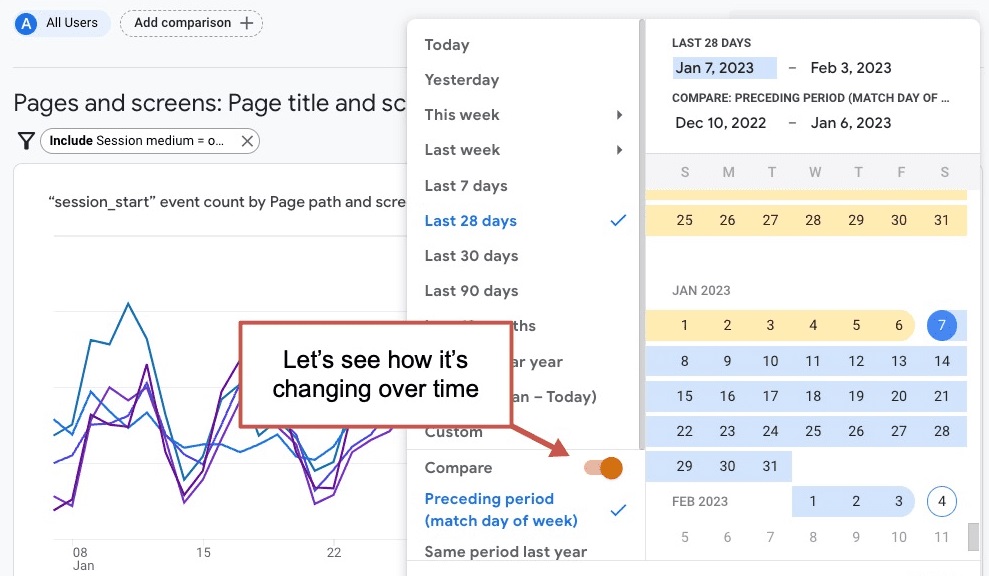
Now, the identical report reveals fluctuations in organic traffic—some rising, some falling. A quick scan will pinpoint the pages that require some attention and care.
This approach proves more valuable than monitoring rankings for particular phrases. While tracking ranks has its merits, it falls short when considering low-performing keywords or when a page ranks for more popular phrases. This specific ranking focus can lead to misleading conclusions.
Often, SEO professionals overly emphasize rankings, neglecting the crucial aspect of real organic traffic. In essence, SEO isn’t solely about rankings—it’s about driving genuine, meaningful traffic to your website.
Next Action Items
Pages experiencing a surge in search traffic might seem fine, but it’s essential to inspect them closely. Many others are doing the same. Ensure everything is current and appealing – it’s akin to tidying up a room frequented by many guests.
Conversely, pages witnessing a decline in search traffic require attention.
To reverse this trend, enhancing the page’s quality is paramount. This improvement can take various forms:
- Incorporate Visual Elements: Add graphics and videos for a more engaging experience.
- Include Expert Quotes: Integrate quotes from subject matter experts to add credibility.
- Provide Supporting Evidence: Use charts and examples to bolster your points.
- Enhance Formatting: Utilize subheadings, bullets, and numbered lists for clarity.
However, the most effective way to boost declining search rankings revolves around content quality and relevance.
Augment the page’s depth by incorporating related phrases that enrich the content contextually. Mere repetition of the target phrase won’t suffice; the focus should be on providing comprehensive answers to related questions, exploring subtopics, and delving deeper into the material. Essentially, aim to create a superior page. This approach is the linchpin of effective SEO.
A potent method to heighten a page’s relevance is to confirm that it encompasses all the phrases it already ranks for. Let’s delve into locating them.
4. Articles With the Potential to Rank Higher in Search Results
In this segment of our content marketing analysis, we move beyond GA4 and delve into Google Search Console (GSC).
While various SEO tools can display the rankings of specific URLs, the primary source remains Google itself. Google Search Console doesn’t monitor changes in rankings for particular phrases, but it does provide the “average position” for any phrase associated with any page over any timeframe.
Here’s how you can utilize Google Search Console to assess the rankings of any page on your website:
- In the Search results report:
- Opt for a recent date range.
- Navigate to the “PAGES” tab.
- Click on the filter icon and input the URL (or a keyword from the URL) to locate the specific page.
- Select the URL to view details about that particular page.
Now, your focus is on the search performance of the chosen URL.
Enable the “Average position” data by checking the corresponding box in the report. Switch to the “QUERIES” tab. Here, you can see the specific keyphrases for which the URL is ranked.
Arrange the list by “Position” and navigate beyond the top-ranking entries.
Next Action Items
Understanding the performance of keyphrases is a vital aspect of a content marketing analysis. It not only provides insights into specific phrases but also helps identify related terms. This knowledge can be leveraged to make SEO-driven enhancements to articles that are on the verge of ranking higher.
By refining articles and incorporating these related phrases, you enhance the relevance of your content for the top search queries. This involves updating the article to include these specific phrases and ensuring that the top-performing phrase aligns with the primary focus of the article. If not, consider reorienting the article around this high-performing phrase and integrating it into the title tag and <h1> header.
The impact of these efforts goes beyond mere improvement in rankings for top phrases. It extends to ranking for a more extensive array of phrases. This exemplifies the essence of semantic SEO—expanding the reach to encompass a broader spectrum of related terms.
5. Recognizing Our Most Effective Email Campaigns
Transitioning from SEO to email marketing, it’s time to evaluate the effectiveness of our email campaigns.
The advantage of using Google Analytics is its ability to provide insights beyond typical email metrics. While your email service provider (ESP) can offer pre-click data like deliverability, open rates, and clickthrough rates, post-click metrics such as traffic, engagement, and conversion rates require campaign tracking codes added to your links and buttons.
If you haven’t been incorporating campaign tracking codes in your emails, it’s a great opportunity to enhance your marketing strategy. Start by using a URL builder to add specific campaign parameters (medium, source, and campaign name) to every link and button in your emails.
Once you’ve implemented these tracking codes, follow these steps to analyze the visitor behaviour resulting from your email campaigns:
- Select a Comprehensive Date Range: Opt for a longer timeframe to compare multiple campaign performances effectively.
- Customize Your Report: From the Acquisition > Traffic Acquisition report, customize your report by clicking the pencil icon in the top right.
- Choose Your Metrics: Select relevant metrics such as Sessions, Engagement Rate, Average Engagement Time per Session, and Conversions. You can drag these metrics to the top for easier analysis. If you don’t find a specific metric, add it by clicking “Add metric” and searching for it.
- Apply Your Selections: Click “Apply” to save your customization. You can save it to the current report and then return to the actual report by clicking “BACK” in the top left.
- Filter for Email Campaigns: Add a filter to view only email campaigns. Click on the “Add filter +” button, select “Session medium” as the dimension, choose “email” from the Dimension values dropdown, and click “Apply.”
- Adjust Primary Dimension: Change the primary dimension from “Default channel group” to “Session campaign” using the dropdown above the first column.
Now, you can assess the performance of every email campaign within the specified date range, provided you’ve added the campaign tracking codes. Keep in mind that this report covers all campaigns, not just email, so you might need to sift through additional data. Additionally, it includes all types of emails, not just content marketing emails.
Upon analysis, you’ll notice significant variations in both traffic and conversion rates among different campaigns.
Next Action Items
Examine the high-performing campaigns meticulously. Scrutinize every aspect, from topics and timing to subject lines, creative content, teaser text, and calls to action. Identify the common factors shared by these exceptional cases.
To replicate the success, model your future campaigns after these top performers. Consider resending the most successful ones with fresh subject lines to sustain the positive outcomes.
6. Identifying The Social Networks Where Content Performs Exceptionally Well
Now, let’s shift our focus to social media marketing!
Our first task is to assess the performance of different social networks. It’s essential to recognize that our content topics and formats may not yield the same results across various social platforms. Certain networks are inherently more effective than others.
To evaluate the performance of diverse social networks, follow these steps. We’ll utilize the same report customizations as before, encompassing metrics like users, sessions, engagement rate, and conversion rates.
- Navigate to Acquisition > Traffic Acquisition Report
- Refine the Data: Click “Add filter +” to narrow down the data to social media traffic exclusively.
- Choose the Dimension: Select “First User Default Channel Group” as the dimension.
- Select Data Values: Click “Select Dimension Values,” and mark the “Organic Social” box.
- Apply the Filter: Click “Apply” to implement the filter.
- Modify the Primary Dimension: Using the dropdown above the first column, switch the primary dimension from “Session Default Channel Group” to “Session Source.”
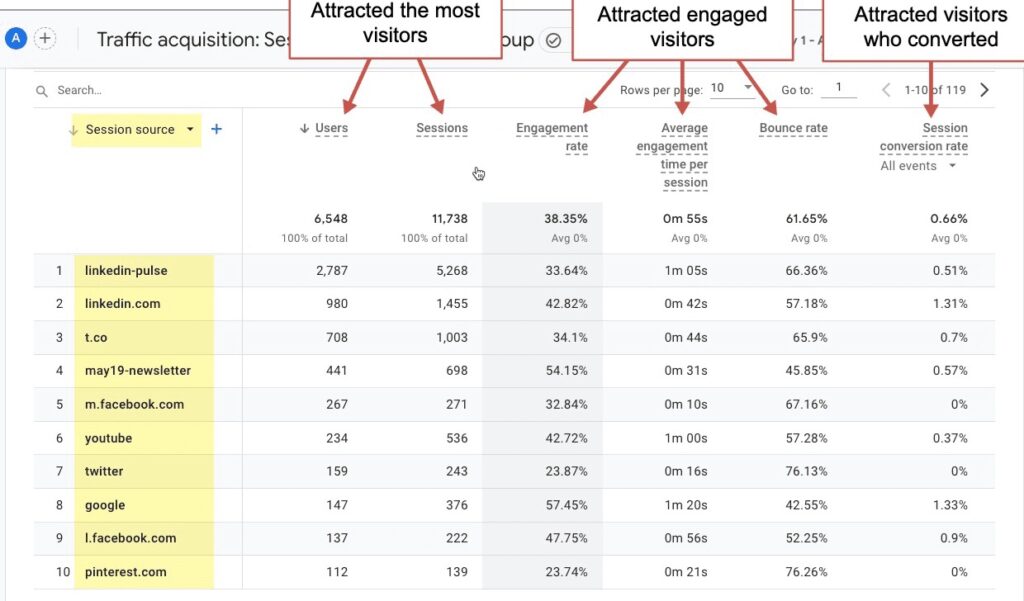
Following these steps allows for a comprehensive evaluation of the performance of various social networks, enabling more informed decisions in your social media marketing strategies.
Next Action Items
Similar to analyzing default channel groups, we recommend specific actions based on each social network’s alignment with your goals.
- Low Traffic, High Conversions: If a social network drives low traffic but boasts high conversion rates, increase your activity on that platform. It proves fruitful for conversions despite the limited traffic.
- High Traffic, Low Conversions: For social networks generating significant traffic but lacking in conversion rates, recognize their value in brand awareness. While they might not contribute substantially to the middle or bottom of your sales funnel, they play a vital role in brand visibility and recognition.
- High Performance Across the Board: If a social network excels in both traffic and conversions, consider intensifying your efforts and investments there. Such platforms offer substantial returns and are worth a more significant investment.
7. Pinpointing The Content That Receives The Highest Traffic and Engagement on Social Platforms
Delving deeper into the analysis adds an intriguing layer to our insights.
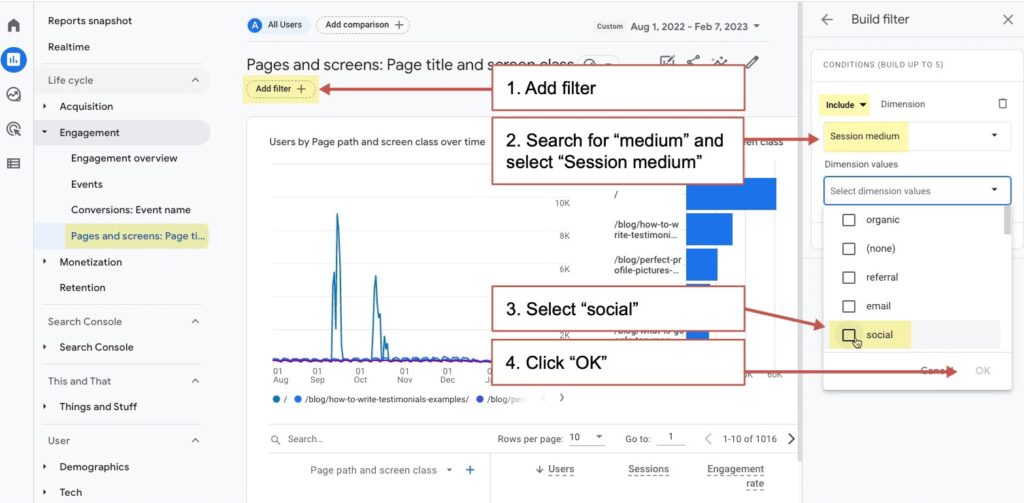
Now, let’s focus on evaluating the performance of individual articles within social media channels. Since we’re examining specific pages, we’ll navigate to the Engagement > Pages and Screens report.
- Refine Your Data: Click on “Add Filter +” to narrow down the data to social traffic exclusively.
- Choose the Dimension: Select “Session Medium” as the dimension.
- Specify Dimension Value: Set the dimension value to “social.”
- Confirm Selection: Click “OK” to confirm your choices.
By following these steps, we can closely examine how each article performs within the realm of social media channels, providing us with valuable insights into the effectiveness of our content strategies.
Next Action Items
Scrutinize the standout performers, paying particular attention to their headlines, formatting, and visuals. Identify the common elements shared by these top performers.
Generate more content incorporating these same attributes for social media promotion. Additionally, for articles boasting the highest engagement levels, ensure they receive ample exposure through consistent and frequent sharing on social platforms.
8. Determining the Best Performing Platform for This Article
To track an article’s traction across all traffic sources without excluding any, follow these steps:
- Navigate to the Engagement > Pages and Screens report.
- Set the primary dimension to “Page Path and Screen Class.”
- Search for the specific article.
- Click the blue plus sign (+) to add a second dimension and select “Session Source/Medium.”
- If the article includes embedded content or video, enhance the report by adding the “Event Count” metric. Choose the “page_view” or “video_start” event, which is pre-configured for GA4 and requires no additional setup.
Next Action Items
This report serves as a catalyst for generating new content promotion strategies.
- Low Traffic from Email or Social Sources: If the total traffic from an email or social source appears unexpectedly low, consider re-promoting the content through these channels to boost visibility.
- High Engagement in Specific Channels: Continue promoting the article across any channel where engagement surpassed the average. Persistent promotion in these active channels can maximize its impact.
If you’re seeking more ideas, refer to our comprehensive list of 76 ways to promote an article.
For more in-depth analysis, explore options like extracting data from Google Analytics into platforms such as Big Query, Looker Studio (formerly Google Data Studio), or Google Sheets. These tools enable a more detailed examination of your data, aiding in a comprehensive understanding of your content’s performance.
Conclusion
Think of it like this: our goal is to achieve the best results with the least amount of work. In the world of digital marketing, there are endless things we can do, but not all of them make a big impact. The purpose of this process is to help us focus on the actions that really matter and can make a difference.
Surprisingly, we accomplished all of this using the basic settings available in GA4, a tool for tracking website data. We didn’t need any complicated technical stuff.
In digital marketing, the job is never really finished. It’s not just about creating and promoting content; it’s also about regularly checking how well it’s doing. These check-ins, called content audits, help us understand what’s working and what needs improvement in a simple and effective way.